Page | 003 Patients with fibromyalgia were consecutively enrolled be- tween May and August 2019 and randomly allocated 1:1 to receive either pulsed electromagnetic field-triple energy pain treatment (PEMF-TEPT) (n = 10, herein referred to as ac- tive treatment) on pre-specified points or minimal intensity applied on scrambled points (n = 11 controls) for 20 min at baseline (W0) and after 4 weeks (W4) and 8 weeks (W8) (end of follow up: October 2019).
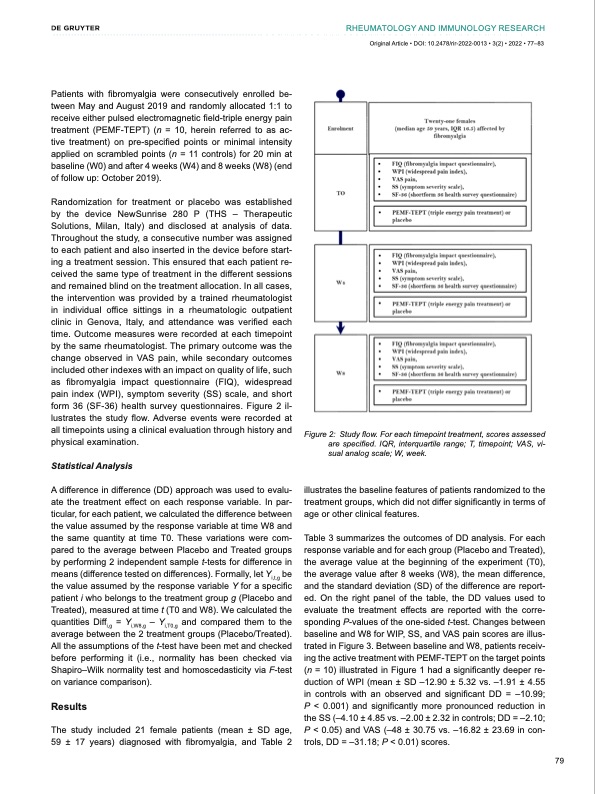
Randomization for treatment or placebo was established by the device NewSunrise 280 P (THS – Therapeutic Solutions, Milan, Italy) and disclosed at analysis of data. Throughout the study, a consecutive number was assigned to each patient and also inserted in the device before start- ing a treatment session. This ensured that each patient re- ceived the same type of treatment in the different sessions and remained blind on the treatment allocation. In all cases, the intervention was provided by a trained rheumatologist in individual office sittings in a rheumatologic outpatient clinic in Genova, Italy, and attendance was verified each time. Outcome measures were recorded at each timepoint by the same rheumatologist. The primary outcome was the change observed in VAS pain, while secondary outcomes included other indexes with an impact on quality of life, such as fibromyalgia impact questionnaire (FIQ), widespread pain index (WPI), symptom severity (SS) scale, and short form 36 (SF-36) health survey questionnaires. Figure 2 il- lustrates the study flow. Adverse events were recorded at all timepoints using a clinical evaluation through history and physical examination.
Statistical Analysis
A difference in difference (DD) approach was used to evalu- ate the treatment effect on each response variable. In par- ticular, for each patient, we calculated the difference between the value assumed by the response variable at time W8 and the same quantity at time T0. These variations were com- pared to the average between Placebo and Treated groups by performing 2 independent sample t-tests for difference in means (difference tested on differences). Formally, let Yi,t,g be the value assumed by the response variable Y for a specific patient i who belongs to the treatment group g (Placebo and Treated), measured at time t (T0 and W8). We calculated the quantities Diffi,g = Yi,W8,g – Yi,T0,g and compared them to the average between the 2 treatment groups (Placebo/Treated). All the assumptions of the t-test have been met and checked before performing it (i.e., normality has been checked via Shapiro–Wilk normality test and homoscedasticity via F-test on variance comparison).
Results
The study included 21 female patients (mean ± SD age, 59 ± 17 years) diagnosed with fibromyalgia, and Table 2
RHEUMATOLOGY AND IMMUNOLOGY RESEARCH
Original Article • DOI: 10.2478/rir-2022-0013 • 3(2) • 2022 • 77–83
Figure 2: Study flow. For each timepoint treatment, scores assessed are specified. IQR, interquartile range; T, timepoint; VAS, vi- sual analog scale; W, week.
illustrates the baseline features of patients randomized to the treatment groups, which did not differ significantly in terms of age or other clinical features.
Table 3 summarizes the outcomes of DD analysis. For each response variable and for each group (Placebo and Treated), the average value at the beginning of the experiment (T0), the average value after 8 weeks (W8), the mean difference, and the standard deviation (SD) of the difference are report- ed. On the right panel of the table, the DD values used to evaluate the treatment effects are reported with the corre- sponding P-values of the one-sided t-test. Changes between baseline and W8 for WIP, SS, and VAS pain scores are illus- trated in Figure 3. Between baseline and W8, patients receiv- ing the active treatment with PEMF-TEPT on the target points (n = 10) illustrated in Figure 1 had a significantly deeper re- duction of WPI (mean ± SD –12.90 ± 5.32 vs. –1.91 ± 4.55 in controls with an observed and significant DD = –10.99; P < 0.001) and significantly more pronounced reduction in the SS (–4.10 ± 4.85 vs. –2.00 ± 2.32 in controls; DD = –2.10; P < 0.05) and VAS (–48 ± 30.75 vs. –16.82 ± 23.69 in con- trols, DD = –31.18; P < 0.01) scores.
79
|