PDF Publication Title:
Text from PDF Page: 005
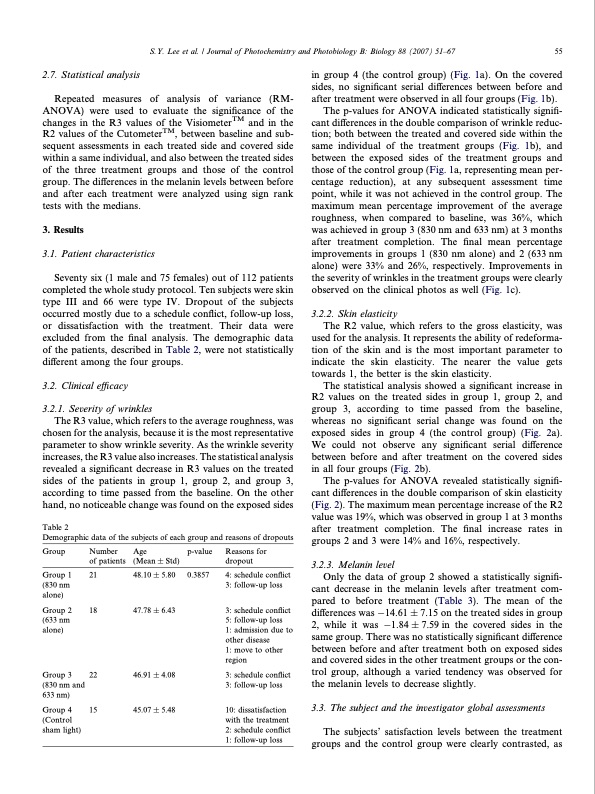
S.Y. Lee et al. / Journal of Photochemistry and Photobiology B: Biology 88 (2007) 51–67 55 2.7. Statistical analysis Repeated measures of analysis of variance (RM- ANOVA) were used to evaluate the significance of the changes in the R3 values of the VisiometerTM and in the R2 values of the CutometerTM, between baseline and sub- sequent assessments in each treated side and covered side within a same individual, and also between the treated sides of the three treatment groups and those of the control group. The differences in the melanin levels between before and after each treatment were analyzed using sign rank tests with the medians. 3. Results 3.1. Patient characteristics Seventy six (1 male and 75 females) out of 112 patients completed the whole study protocol. Ten subjects were skin type III and 66 were type IV. Dropout of the subjects occurred mostly due to a schedule conflict, follow-up loss, or dissatisfaction with the treatment. Their data were excluded from the final analysis. The demographic data of the patients, described in Table 2, were not statistically different among the four groups. 3.2. Clinical efficacy 3.2.1. Severity of wrinkles The R3 value, which refers to the average roughness, was chosen for the analysis, because it is the most representative parameter to show wrinkle severity. As the wrinkle severity increases, the R3 value also increases. The statistical analysis revealed a significant decrease in R3 values on the treated sides of the patients in group 1, group 2, and group 3, according to time passed from the baseline. On the other hand, no noticeable change was found on the exposed sides in group 4 (the control group) (Fig. 1a). On the covered sides, no significant serial differences between before and after treatment were observed in all four groups (Fig. 1b). The p-values for ANOVA indicated statistically signifi- cant differences in the double comparison of wrinkle reduc- tion; both between the treated and covered side within the same individual of the treatment groups (Fig. 1b), and between the exposed sides of the treatment groups and those of the control group (Fig. 1a, representing mean per- centage reduction), at any subsequent assessment time point, while it was not achieved in the control group. The maximum mean percentage improvement of the average roughness, when compared to baseline, was 36%, which was achieved in group 3 (830 nm and 633 nm) at 3 months after treatment completion. The final mean percentage improvements in groups 1 (830 nm alone) and 2 (633 nm alone) were 33% and 26%, respectively. Improvements in the severity of wrinkles in the treatment groups were clearly observed on the clinical photos as well (Fig. 1c). 3.2.2. Skin elasticity The R2 value, which refers to the gross elasticity, was used for the analysis. It represents the ability of redeforma- tion of the skin and is the most important parameter to indicate the skin elasticity. The nearer the value gets towards 1, the better is the skin elasticity. The statistical analysis showed a significant increase in R2 values on the treated sides in group 1, group 2, and group 3, according to time passed from the baseline, whereas no significant serial change was found on the exposed sides in group 4 (the control group) (Fig. 2a). We could not observe any significant serial difference between before and after treatment on the covered sides in all four groups (Fig. 2b). The p-values for ANOVA revealed statistically signifi- cant differences in the double comparison of skin elasticity (Fig. 2). The maximum mean percentage increase of the R2 value was 19%, which was observed in group 1 at 3 months after treatment completion. The final increase rates in groups 2 and 3 were 14% and 16%, respectively. 3.2.3. Melanin level Only the data of group 2 showed a statistically signifi- cant decrease in the melanin levels after treatment com- pared to before treatment (Table 3). The mean of the differences was 14.61 ± 7.15 on the treated sides in group 2, while it was 1.84 ± 7.59 in the covered sides in the same group. There was no statistically significant difference between before and after treatment both on exposed sides and covered sides in the other treatment groups or the con- trol group, although a varied tendency was observed for the melanin levels to decrease slightly. 3.3. The subject and the investigator global assessments The subjects’ satisfaction levels between the treatment groups and the control group were clearly contrasted, as Table 2 Demographic data of the subjects of each group and reasons of dropouts Reasons for dropout 4: schedule conflict 3: follow-up loss 3: schedule conflict 5: follow-up loss 1: admission due to other disease 1: move to other region 3: schedule conflict 3: follow-up loss 10: dissatisfaction with the treatment 2: schedule conflict 1: follow-up loss Group Group 1 (830 nm alone) Group 2 (633 nm alone) Group 3 (830 nm and 633 nm) Group 4 (Control sham light) Number of patients 21 18 22 15 Age (Mean ± Std) 48.10 ± 5.80 47.78 ± 6.43 46.91 ± 4.08 45.07 ± 5.48 p-value 0.3857PDF Image | LED phototherapy for skin rejuvenation

PDF Search Title:
LED phototherapy for skin rejuvenationOriginal File Name Searched:
LED-phototherapy-for-skin-rejuvenation.pdfDIY PDF Search: Google It | Yahoo | Bing
Cruise Ship Reviews | Luxury Resort | Jet | Yacht | and Travel Tech More Info
Cruising Review Topics and Articles More Info
Software based on Filemaker for the travel industry More Info
The Burgenstock Resort: Reviews on CruisingReview website... More Info
Resort Reviews: World Class resorts... More Info
The Riffelalp Resort: Reviews on CruisingReview website... More Info
| CONTACT TEL: 608-238-6001 Email: greg@cruisingreview.com | RSS | AMP |