PDF Publication Title:
Text from PDF Page: 003
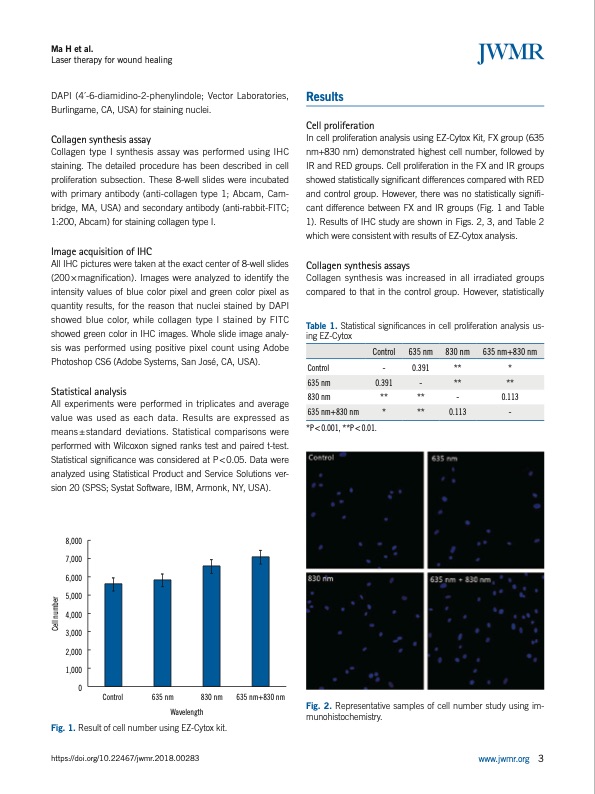
Ma H et al. Laser therapy for wound healing DAPI (4 ́-6-diamidino-2-phenylindole; Vector Laboratories, Burlingame, CA, USA) for staining nuclei. Collagen synthesis assay Collagen type I synthesis assay was performed using IHC staining. The detailed procedure has been described in cell proliferation subsection. These 8-well slides were incubated with primary antibody (anti-collagen type 1; Abcam, Cam- bridge, MA, USA) and secondary antibody (anti-rabbit-FITC; 1:200, Abcam) for staining collagen type I. Image acquisition of IHC All IHC pictures were taken at the exact center of 8-well slides (200 × magnification). Images were analyzed to identify the intensity values of blue color pixel and green color pixel as quantity results, for the reason that nuclei stained by DAPI showed blue color, while collagen type I stained by FITC showed green color in IHC images. Whole slide image analy- sis was performed using positive pixel count using Adobe Photoshop CS6 (Adobe Systems, San José, CA, USA). Statistical analysis All experiments were performed in triplicates and average value was used as each data. Results are expressed as means±standard deviations. Statistical comparisons were performed with Wilcoxon signed ranks test and paired t-test. Statistical significance was considered at P<0.05. Data were analyzed using Statistical Product and Service Solutions ver- sion 20 (SPSS; Systat Software, IBM, Armonk, NY, USA). Results Cell proliferation In cell proliferation analysis using EZ-Cytox Kit, FX group (635 nm+830 nm) demonstrated highest cell number, followed by IR and RED groups. Cell proliferation in the FX and IR groups showed statistically significant differences compared with RED and control group. However, there was no statistically signifi- cant difference between FX and IR groups (Fig. 1 and Table 1). Results of IHC study are shown in Figs. 2, 3, and Table 2 which were consistent with results of EZ-Cytox analysis. Collagen synthesis assays Collagen synthesis was increased in all irradiated groups compared to that in the control group. However, statistically Table 1. Statistical significances in cell proliferation analysis us- ing EZ-Cytox Control 635 nm 830 nm 635 nm+830 nm Control 830nm ** ** - 0.113 *P < 0.001, **P < 0.01. Fig. 2. Representative samples of cell number study using im- munohistochemistry. www.jwmr.org 3 - 0.391 ** * 635 nm 0.391 - ** ** 635 nm+830 nm * ** 0.113 - 8,000 7,000 6,000 5,000 4,000 3,000 2,000 1,000 0 Control 635 nm Wavelength 635 nm+830 nm Fig. 1. Result of cell number using EZ-Cytox kit. https://doi.org/10.22467/jwmr.2018.00283 830 nm Cell numberPDF Image | Low-Level Laser Therapy on Proliferation and Collagen Synthesis of Human Fibroblasts
PDF Search Title:
Low-Level Laser Therapy on Proliferation and Collagen Synthesis of Human FibroblastsOriginal File Name Searched:
jwmr-2018-00283.pdfDIY PDF Search: Google It | Yahoo | Bing
Cruise Ship Reviews | Luxury Resort | Jet | Yacht | and Travel Tech More Info
Cruising Review Topics and Articles More Info
Software based on Filemaker for the travel industry More Info
The Burgenstock Resort: Reviews on CruisingReview website... More Info
Resort Reviews: World Class resorts... More Info
The Riffelalp Resort: Reviews on CruisingReview website... More Info
| CONTACT TEL: 608-238-6001 Email: greg@cruisingreview.com | RSS | AMP |