PDF Publication Title:
Text from PDF Page: 005
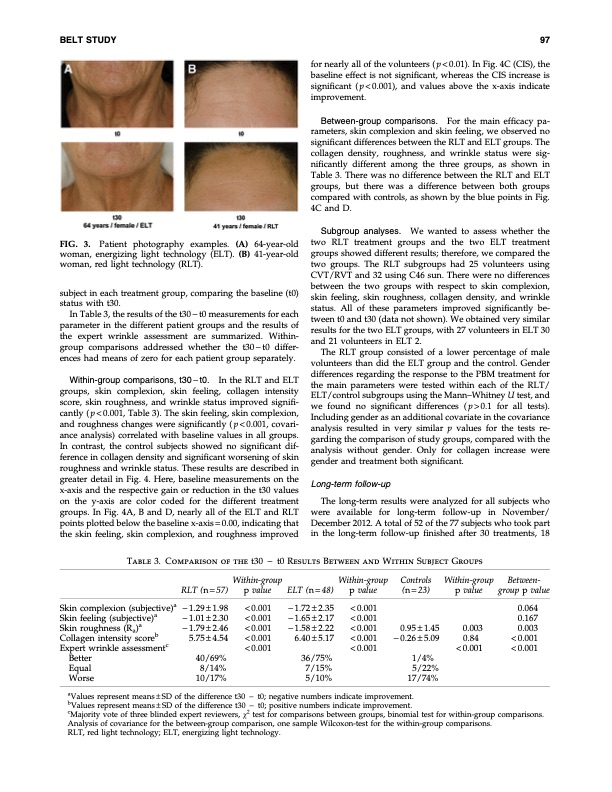
BELT STUDY 97 FIG. 3. Patient photography examples. (A) 64-year-old woman, energizing light technology (ELT). (B) 41-year-old woman, red light technology (RLT). subject in each treatment group, comparing the baseline (t0) status with t30. In Table 3, the results of the t30 - t0 measurements for each parameter in the different patient groups and the results of the expert wrinkle assessment are summarized. Within- group comparisons addressed whether the t30-t0 differ- ences had means of zero for each patient group separately. Within-group comparisons, t30 - t0. In the RLT and ELT groups, skin complexion, skin feeling, collagen intensity score, skin roughness, and wrinkle status improved signifi- cantly ( p < 0.001, Table 3). The skin feeling, skin complexion, and roughness changes were significantly ( p < 0.001, covari- ance analysis) correlated with baseline values in all groups. In contrast, the control subjects showed no significant dif- ference in collagen density and significant worsening of skin roughness and wrinkle status. These results are described in greater detail in Fig. 4. Here, baseline measurements on the x-axis and the respective gain or reduction in the t30 values on the y-axis are color coded for the different treatment groups. In Fig. 4A, B and D, nearly all of the ELT and RLT points plotted below the baseline x-axis = 0.00, indicating that the skin feeling, skin complexion, and roughness improved for nearly all of the volunteers ( p < 0.01). In Fig. 4C (CIS), the baseline effect is not significant, whereas the CIS increase is significant (p<0.001), and values above the x-axis indicate improvement. Between-group comparisons. For the main efficacy pa- rameters, skin complexion and skin feeling, we observed no significant differences between the RLT and ELT groups. The collagen density, roughness, and wrinkle status were sig- nificantly different among the three groups, as shown in Table 3. There was no difference between the RLT and ELT groups, but there was a difference between both groups compared with controls, as shown by the blue points in Fig. 4C and D. Subgroup analyses. We wanted to assess whether the two RLT treatment groups and the two ELT treatment groups showed different results; therefore, we compared the two groups. The RLT subgroups had 25 volunteers using CVT/RVT and 32 using C46 sun. There were no differences between the two groups with respect to skin complexion, skin feeling, skin roughness, collagen density, and wrinkle status. All of these parameters improved significantly be- tween t0 and t30 (data not shown). We obtained very similar results for the two ELT groups, with 27 volunteers in ELT 30 and 21 volunteers in ELT 2. The RLT group consisted of a lower percentage of male volunteers than did the ELT group and the control. Gender differences regarding the response to the PBM treatment for the main parameters were tested within each of the RLT/ ELT/control subgroups using the Mann–Whitney U test, and we found no significant differences (p>0.1 for all tests). Including gender as an additional covariate in the covariance analysis resulted in very similar p values for the tests re- garding the comparison of study groups, compared with the analysis without gender. Only for collagen increase were gender and treatment both significant. Long-term follow-up The long-term results were analyzed for all subjects who were available for long-term follow-up in November/ December 2012. A total of 52 of the 77 subjects who took part in the long-term follow-up finished after 30 treatments, 18 Table 3. Comparison of the t30 - t0 Results Between and Within Subject Groups Skin complexion (subjective)a Skin feeling (subjective)a Skin roughness (Ra)a Collagen intensity scoreb Expert wrinkle assessmentc Better Equal Worse RLT (n = 57) - 1.29 – 1.98 - 1.01 – 2.30 - 1.79 – 2.46 5.75 – 4.54 40/69% 8/14% 10/17% Within-group p value < 0.001 < 0.001 < 0.001 < 0.001 < 0.001 ELT (n = 48) - 1.72 – 2.35 - 1.65 – 2.17 - 1.58 – 2.22 6.40 – 5.17 36/75% 7/15% 5/10% Within-group p value < 0.001 < 0.001 < 0.001 < 0.001 < 0.001 Controls (n = 23) 0.95 – 1.45 - 0.26 – 5.09 1/4% 5/22% 17/74% Within-group p value 0.003 0.84 < 0.001 Between- group p value 0.064 0.167 0.003 < 0.001 < 0.001 aValues represent means – SD of the difference t30 - t0; negative numbers indicate improvement. bValues represent means – SD of the difference t30 - t0; positive numbers indicate improvement. cMajority vote of three blinded expert reviewers, v2 test for comparisons between groups, binomial test for within-group comparisons. Analysis of covariance for the between-group comparison, one sample Wilcoxon-test for the within-group comparisons. RLT, red light technology; ELT, energizing light technology.PDF Image | Trial to Determine the Efficacy of Red Near-Infrared Light Treatment
PDF Search Title:
Trial to Determine the Efficacy of Red Near-Infrared Light TreatmentOriginal File Name Searched:
red-light-treatment.pdfDIY PDF Search: Google It | Yahoo | Bing
Cruise Ship Reviews | Luxury Resort | Jet | Yacht | and Travel Tech More Info
Cruising Review Topics and Articles More Info
Software based on Filemaker for the travel industry More Info
The Burgenstock Resort: Reviews on CruisingReview website... More Info
Resort Reviews: World Class resorts... More Info
The Riffelalp Resort: Reviews on CruisingReview website... More Info
| CONTACT TEL: 608-238-6001 Email: greg@cruisingreview.com | RSS | AMP |