PDF Publication Title:
Text from PDF Page: 003
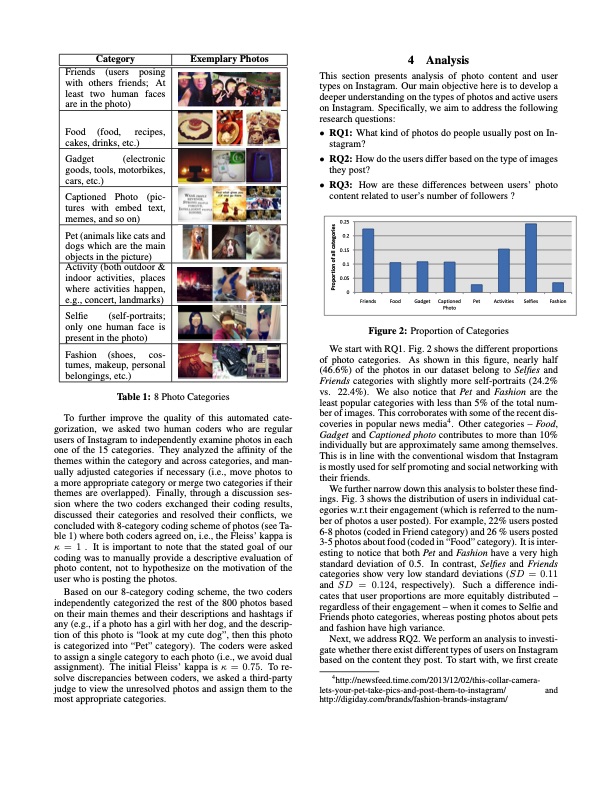
Category Exemplary Photos 4 Analysis This section presents analysis of photo content and user types on Instagram. Our main objective here is to develop a deeper understanding on the types of photos and active users on Instagram. Specifically, we aim to address the following research questions: • RQ1: What kind of photos do people usually post on In- stagram? • RQ2: How do the users differ based on the type of images they post? • RQ3: How are these differences between users’ photo content related to user’s number of followers ? Friends (users posing with others friends; At least two human faces are in the photo) Food (food, recipes, cakes, drinks, etc.) Gadget (electronic goods, tools, motorbikes, cars, etc.) Captioned Photo (pic- tures with embed text, memes, and so on) Pet (animals like cats and dogs which are the main objects in the picture) Selfie (self-portraits; only one human face is present in the photo) Fashion (shoes, cos- tumes, makeup, personal belongings, etc.) Table 1: 8 Photo Categories To further improve the quality of this automated cate- gorization, we asked two human coders who are regular users of Instagram to independently examine photos in each one of the 15 categories. They analyzed the affinity of the themes within the category and across categories, and man- ually adjusted categories if necessary (i.e., move photos to a more appropriate category or merge two categories if their themes are overlapped). Finally, through a discussion ses- sion where the two coders exchanged their coding results, discussed their categories and resolved their conflicts, we concluded with 8-category coding scheme of photos (see Ta- ble 1) where both coders agreed on, i.e., the Fleiss’ kappa is κ = 1 . It is important to note that the stated goal of our coding was to manually provide a descriptive evaluation of photo content, not to hypothesize on the motivation of the user who is posting the photos. Figure 2: Proportion of Categories We start with RQ1. Fig. 2 shows the different proportions of photo categories. As shown in this figure, nearly half (46.6%) of the photos in our dataset belong to Selfies and Friends categories with slightly more self-portraits (24.2% vs. 22.4%). We also notice that Pet and Fashion are the least popular categories with less than 5% of the total num- ber of images. This corroborates with some of the recent dis- coveries in popular news media4. Other categories – Food, Gadget and Captioned photo contributes to more than 10% individually but are approximately same among themselves. This is in line with the conventional wisdom that Instagram is mostly used for self promoting and social networking with their friends. We further narrow down this analysis to bolster these find- ings. Fig. 3 shows the distribution of users in individual cat- egories w.r.t their engagement (which is referred to the num- ber of photos a user posted). For example, 22% users posted 6-8 photos (coded in Friend category) and 26 % users posted 3-5 photos about food (coded in “Food” category). It is inter- esting to notice that both Pet and Fashion have a very high standard deviation of 0.5. In contrast, Selfies and Friends categories show very low standard deviations (SD = 0.11 and SD = 0.124, respectively). Such a difference indi- cates that user proportions are more equitably distributed – regardless of their engagement – when it comes to Selfie and Friends photo categories, whereas posting photos about pets and fashion have high variance. 0.25 0.2 0.15 0.1 0.05 0 Friends Food Gadget Captioned Pet Photo Activities Selfies Fashion Activity (both outdoor & indoor activities, places where activities happen, e.g., concert, landmarks) Based on our 8-category coding scheme, the two coders independently categorized the rest of the 800 photos based on their main themes and their descriptions and hashtags if any (e.g., if a photo has a girl with her dog, and the descrip- tion of this photo is “look at my cute dog”, then this photo is categorized into “Pet” category). The coders were asked to assign a single category to each photo (i.e., we avoid dual assignment). The initial Fleiss’ kappa is κ = 0.75. To re- solve discrepancies between coders, we asked a third-party judge to view the unresolved photos and assign them to the most appropriate categories. http://digiday.com/brands/fashion-brands-instagram/ Next, we address RQ2. We perform an analysis to investi- gate whether there exist different types of users on Instagram based on the content they post. To start with, we first create 4 http://newsfeed.time.com/2013/12/02/this-collar-camera- lets-your-pet-take-pics-and-post-them-to-instagram/ and Proportion of all categoriesPDF Image | Instagram: Analysis of Instagram Photo Content and User Types
PDF Search Title:
Instagram: Analysis of Instagram Photo Content and User TypesOriginal File Name Searched:
instagram-icwsm.pdfDIY PDF Search: Google It | Yahoo | Bing
Cruise Ship Reviews | Luxury Resort | Jet | Yacht | and Travel Tech More Info
Cruising Review Topics and Articles More Info
Software based on Filemaker for the travel industry More Info
The Burgenstock Resort: Reviews on CruisingReview website... More Info
Resort Reviews: World Class resorts... More Info
The Riffelalp Resort: Reviews on CruisingReview website... More Info
| CONTACT TEL: 608-238-6001 Email: greg@cruisingreview.com | RSS | AMP |