PDF Publication Title:
Text from PDF Page: 007
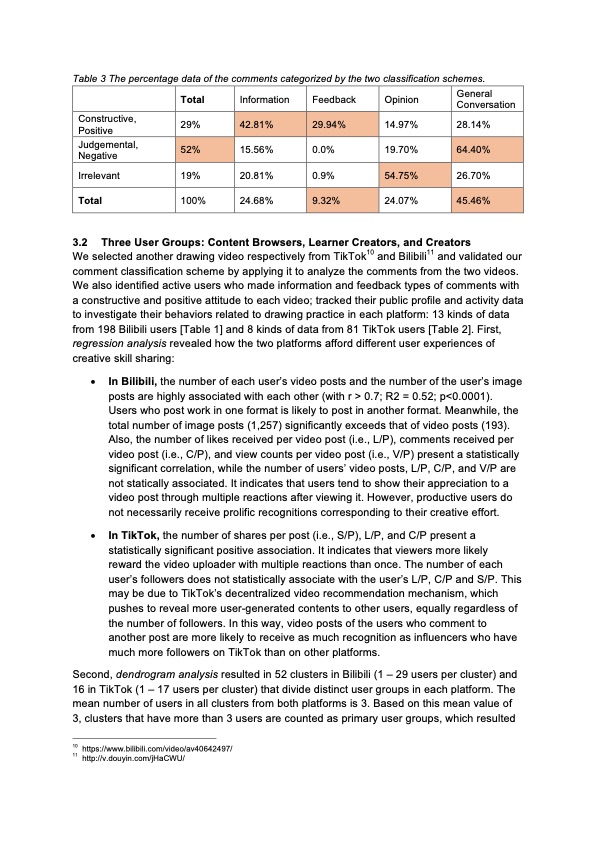
Table 3 The percentage data of the comments categorized by the two classification schemes. Constructive, Positive Judgemental, Negative Irrelevant 19% Total 100% Opinion 14.97% 28.14% Total Information 29% Feedback 0.9% General Conversation 42.81% 29.94% 52% 15.56% 0.0% 19.70% 64.40% 54.75% 26.70% 9.32% 24.07% 45.46% 20.81% 24.68% 3.2 Three User Groups: Content Browsers, Learner Creators, and Creators We selected another drawing video respectively from TikTok10 and Bilibili11 and validated our comment classification scheme by applying it to analyze the comments from the two videos. We also identified active users who made information and feedback types of comments with a constructive and positive attitude to each video; tracked their public profile and activity data to investigate their behaviors related to drawing practice in each platform: 13 kinds of data from 198 Bilibili users [Table 1] and 8 kinds of data from 81 TikTok users [Table 2]. First, regression analysis revealed how the two platforms afford different user experiences of creative skill sharing: • In Bilibili, the number of each user’s video posts and the number of the user’s image posts are highly associated with each other (with r > 0.7; R2 = 0.52; p<0.0001). Users who post work in one format is likely to post in another format. Meanwhile, the total number of image posts (1,257) significantly exceeds that of video posts (193). Also, the number of likes received per video post (i.e., L/P), comments received per video post (i.e., C/P), and view counts per video post (i.e., V/P) present a statistically significant correlation, while the number of users’ video posts, L/P, C/P, and V/P are not statically associated. It indicates that users tend to show their appreciation to a video post through multiple reactions after viewing it. However, productive users do not necessarily receive prolific recognitions corresponding to their creative effort. • In TikTok, the number of shares per post (i.e., S/P), L/P, and C/P present a statistically significant positive association. It indicates that viewers more likely reward the video uploader with multiple reactions than once. The number of each user’s followers does not statistically associate with the user’s L/P, C/P and S/P. This may be due to TikTok’s decentralized video recommendation mechanism, which pushes to reveal more user-generated contents to other users, equally regardless of the number of followers. In this way, video posts of the users who comment to another post are more likely to receive as much recognition as influencers who have much more followers on TikTok than on other platforms. Second, dendrogram analysis resulted in 52 clusters in Bilibili (1 – 29 users per cluster) and 16 in TikTok (1 – 17 users per cluster) that divide distinct user groups in each platform. The mean number of users in all clusters from both platforms is 3. Based on this mean value of 3, clusters that have more than 3 users are counted as primary user groups, which resulted 10 https://www.bilibili.com/video/av40642497/ 11 http://v.douyin.com/jHaCWU/PDF Image | Learning and Sharing Creative Skills with Short Videos
PDF Search Title:
Learning and Sharing Creative Skills with Short VideosOriginal File Name Searched:
le-f-1209-Zho-Q.pdfDIY PDF Search: Google It | Yahoo | Bing
Cruise Ship Reviews | Luxury Resort | Jet | Yacht | and Travel Tech More Info
Cruising Review Topics and Articles More Info
Software based on Filemaker for the travel industry More Info
The Burgenstock Resort: Reviews on CruisingReview website... More Info
Resort Reviews: World Class resorts... More Info
The Riffelalp Resort: Reviews on CruisingReview website... More Info
| CONTACT TEL: 608-238-6001 Email: greg@cruisingreview.com | RSS | AMP |