PDF Publication Title:
Text from PDF Page: 107
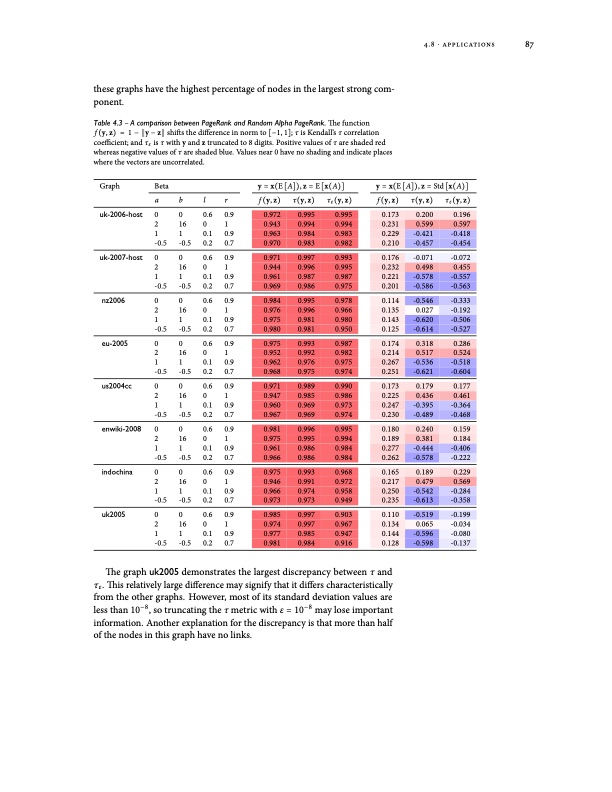
these graphs have the highest percentage of nodes in the largest strong com- ponent. Table 4.3 – A comparison between PageRank and Random Alpha PageRank. The function f (y, z) = 1 − ∥y − z∥ shifts the difference in norm to [−1, 1]; τ is Kendall’s τ correlation coefficient; and τε is τ with y and z truncated to 8 digits. Positive values of τ are shaded red whereas negative values of τ are shaded blue. Values near 0 have no shading and indicate places where the vectors are uncorrelated. 4.8 ⋅ applications 87 Graph Beta a b l y = x(E[A]),z = E[x(A)] y = x(E[A]),z = Std[x(A)] r f(y,z) τ(y,z) τε(y,z) f(y,z) τ(y,z) τε(y,z) 0.9 1 0.9 0.7 0.9 1 0.9 0.7 0.9 1 0.9 0.7 0.9 1 0.9 0.7 0.9 1 0.9 0.7 0.9 1 0.9 0.7 0.9 1 0.9 0.7 0.9 1 0.9 0.7 uk-2006-host 0 2 16 0 1 1 0.1 -0.5 -0.5 0.2 uk-2007-host 0 2 16 0 1 1 0.1 -0.5 -0.5 0.2 nz2006 0 2 16 0 1 1 0.1 -0.5 -0.5 0.2 0 0.6 0.972 0.995 0.995 0.970 0.983 0.982 0.173 0.210 0.200 0.196 0.943 0.994 0.994 0.231 0.599 0.597 0.963 0.984 0.983 0.229 -0.421 -0.418 -0.457 -0.454 0 0.6 0.971 0.997 0.993 0.176 -0.071 -0.072 0.944 0.996 0.995 0.232 0.498 0.455 0.961 0.969 0.987 0.987 0.221 -0.578 -0.586 -0.557 -0.563 0.986 0.975 0.201 0 0.6 0.984 0.976 0.995 0.996 0.975 0.981 0.980 0.978 0.114 -0.546 -0.620 -0.614 -0.333 0.966 0.135 0.027 -0.192 0.143 -0.506 0.980 0.981 0.950 0.125 -0.527 eu-2005 0 2 16 0 1 1 0.1 -0.5 -0.5 0.2 0 0.6 0.975 0.993 0.992 0.987 0.982 0.174 0.318 0.286 0.952 0.214 0.517 0.524 0.962 0.968 0.976 0.975 -0.536 -0.518 us2004cc 0 2 16 0 1 1 0.1 -0.5 -0.5 0.2 enwiki-2008 0 2 16 0 1 1 0.1 -0.5 -0.5 0.2 0 0.6 0.971 0.989 0.990 0.173 0.179 0.177 0.947 0.985 0.986 0.225 0.436 0.461 0.960 0.969 0.247 -0.395 -0.364 0 0.6 0.981 0.975 0.996 0.995 0.180 0.189 0.240 0.159 0.995 0.994 0.381 0.184 0.986 0.984 0.277 -0.444 -0.406 indochina 0 2 16 0 1 1 0.1 -0.5 -0.5 0.2 0 0.6 0.975 0.993 0.991 0.968 0.165 0.189 0.229 0.946 0.972 0.217 0.479 0.569 0.966 0.958 -0.542 -0.284 uk2005 0 2 16 0 1 1 0.1 -0.5 -0.5 0.2 0 0.6 0.985 0.974 0.997 0.997 0.903 0.110 -0.519 -0.199 0.967 0.134 0.065 -0.034 0.977 0.985 0.947 0.144 -0.596 -0.598 -0.080 0.981 0.984 0.916 0.267 0.251 0.975 0.974 0.128 -0.621 -0.604 0.973 0.974 0.967 0.969 0.230 -0.489 -0.468 0.961 0.966 0.986 0.984 0.262 -0.578 -0.222 0.974 0.973 0.250 0.235 0.973 0.949 -0.613 -0.358 -0.137 The graph uk2005 demonstrates the largest discrepancy between τ and τε. This relatively large difference may signify that it differs characteristically from the other graphs. However, most of its standard deviation values are less than 10−8, so truncating the τ metric with ε = 10−8 may lose important information. Another explanation for the discrepancy is that more than half of the nodes in this graph have no links.PDF Image | MODELS AND ALGORITHMS FOR PAGERANK SENSITIVITY
PDF Search Title:
MODELS AND ALGORITHMS FOR PAGERANK SENSITIVITYOriginal File Name Searched:
gleich-pagerank-thesis.pdfDIY PDF Search: Google It | Yahoo | Bing
Cruise Ship Reviews | Luxury Resort | Jet | Yacht | and Travel Tech More Info
Cruising Review Topics and Articles More Info
Software based on Filemaker for the travel industry More Info
The Burgenstock Resort: Reviews on CruisingReview website... More Info
Resort Reviews: World Class resorts... More Info
The Riffelalp Resort: Reviews on CruisingReview website... More Info
| CONTACT TEL: 608-238-6001 Email: greg@cruisingreview.com | RSS | AMP |