PDF Publication Title:
Text from PDF Page: 142
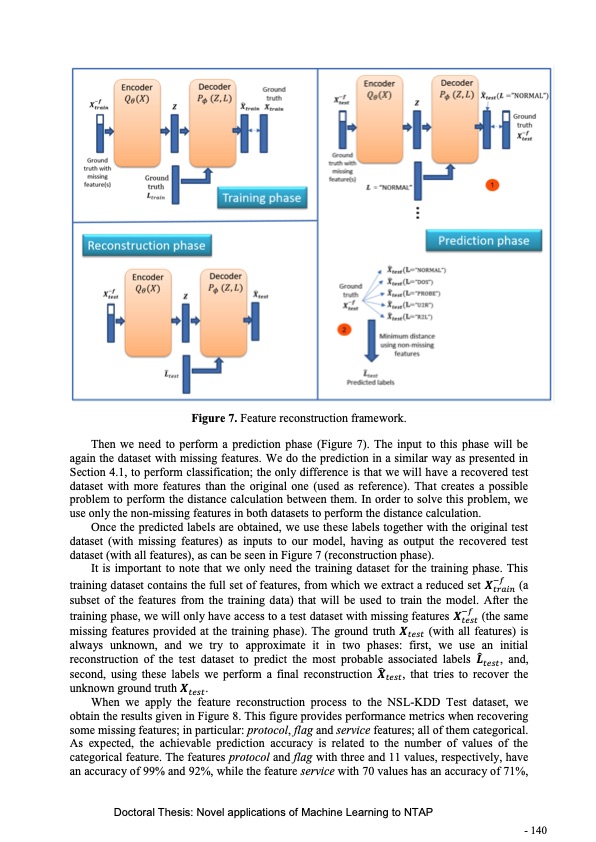
Figure 7. Feature reconstruction framework. Then we need to perform a prediction phase (Figure 7). The input to this phase will be again the dataset with missing features. We do the prediction in a similar way as presented in Section 4.1, to perform classification; the only difference is that we will have a recovered test dataset with more features than the original one (used as reference). That creates a possible problem to perform the distance calculation between them. In order to solve this problem, we use only the non-missing features in both datasets to perform the distance calculation. Once the predicted labels are obtained, we use these labels together with the original test dataset (with missing features) as inputs to our model, having as output the recovered test dataset (with all features), as can be seen in Figure 7 (reconstruction phase). It is important to note that we only need the training dataset for the training phase. This training dataset contains the full set of features, from which we extract a reduced set 𝑿−𝑓 (a subset of the features from the training data) that will be used to train the model. After the training phase, we will only have access to a test dataset with missing features 𝑿−𝑓 (the same 𝑡𝑒𝑠𝑡 missing features provided at the training phase). The ground truth 𝑿𝑡𝑒𝑠𝑡 (with all features) is always unknown, and we try to approximate it in two phases: first, we use an initial ̂ reconstruction of the test dataset to predict the most probable associated labels 𝑳𝑡𝑒𝑠𝑡, and, ̂ second, using these labels we perform a final reconstruction 𝑿𝑡𝑒𝑠𝑡, that tries to recover the unknown ground truth 𝑿𝑡𝑒𝑠𝑡. When we apply the feature reconstruction process to the NSL-KDD Test dataset, we obtain the results given in Figure 8. This figure provides performance metrics when recovering some missing features; in particular: protocol, flag and service features; all of them categorical. As expected, the achievable prediction accuracy is related to the number of values of the categorical feature. The features protocol and flag with three and 11 values, respectively, have an accuracy of 99% and 92%, while the feature service with 70 values has an accuracy of 71%, Doctoral Thesis: Novel applications of Machine Learning to NTAP 𝑡𝑟𝑎𝑖𝑛 - 140PDF Image | Novel applications of Machine Learning to Network Traffic Analysis
PDF Search Title:
Novel applications of Machine Learning to Network Traffic AnalysisOriginal File Name Searched:
456453_1175348.pdfDIY PDF Search: Google It | Yahoo | Bing
Cruise Ship Reviews | Luxury Resort | Jet | Yacht | and Travel Tech More Info
Cruising Review Topics and Articles More Info
Software based on Filemaker for the travel industry More Info
The Burgenstock Resort: Reviews on CruisingReview website... More Info
Resort Reviews: World Class resorts... More Info
The Riffelalp Resort: Reviews on CruisingReview website... More Info
| CONTACT TEL: 608-238-6001 Email: greg@cruisingreview.com | RSS | AMP |