PDF Publication Title:
Text from PDF Page: 006
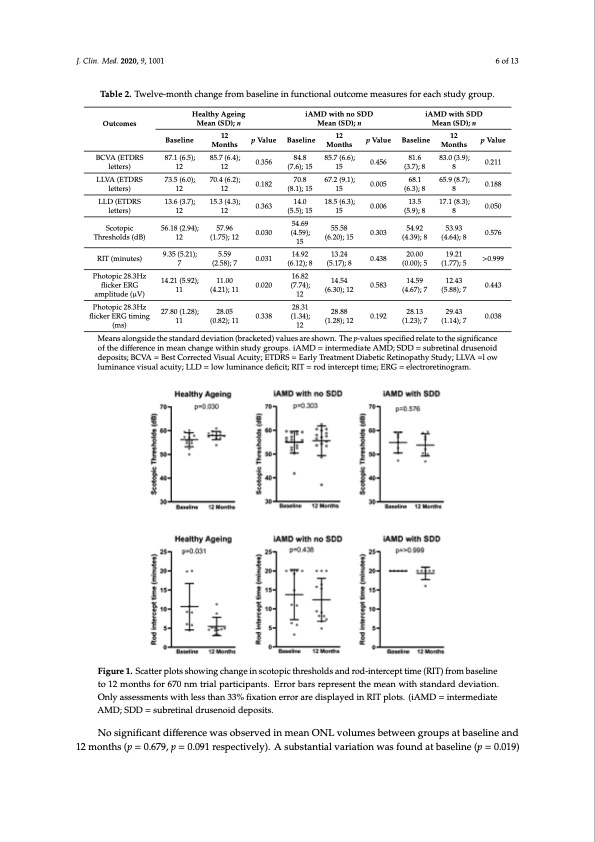
J. Clin. Med. 2020, 9, 1001 6 of 13 Table 2. Twelve-month change from baseline in functional outcome measures for each study group. Outcomes BCVA (ETDRS letters) LLVA (ETDRS letters) LLD (ETDRS letters) Scotopic Thresholds (dB) RIT (minutes) Photopic 28.3Hz flicker ERG amplitude (μV) Photopic 28.3Hz flicker ERG timing (ms) Healthy Ageing Mean (SD); n iAMD with no SDD Mean (SD); n iAMD with SDD Mean (SD); n Baseline 87.1 (6.5); 12 73.5 (6.0); 12 13.6 (3.7); 12 56.18 (2.94); 12 9.35 (5.21); 7 14.21 (5.92); 11 27.80 (1.28); 11 12 Months 85.7 (6.4); 12 70.4 (6.2); 12 15.3 (4.3); 12 57.96 (1.75); 12 5.59 (2.58); 7 11.00 (4.21); 11 28.05 (0.82); 11 p Value 0.356 0.182 0.363 0.030 0.031 0.020 0.338 Baseline 84.8 (7.6); 15 70.8 (8.1); 15 14.0 (5.5); 15 54.69 (4.59); 15 14.92 (6.12); 8 16.82 (7.74); 12 28.31 (1.34); 12 12 Months 85.7 (6.6); 15 67.2 (9.1); 15 18.5 (6.3); 15 55.58 (6.20); 15 13.24 (5.17); 8 14.54 (6.30); 12 28.88 (1.28); 12 p Value 0.456 0.005 0.006 0.303 0.438 0.583 0.192 Baseline 81.6 (3.7); 8 68.1 (6.3); 8 13.5 (5.9); 8 54.92 (4.39); 8 20.00 (0.00); 5 14.59 (4.67); 7 28.13 (1.23); 7 12 Months 83.0 (3.9); 8 65.9 (8.7); 8 17.1 (8.3); 8 53.93 (4.64); 8 19.21 (1.77); 5 12.43 (5.88); 7 29.43 (1.14); 7 p Value 0.211 0.188 0.050 0.576 >0.999 0.443 0.038 Means alongside the standard deviation (bracketed) values are shown. The p-values specified relate to the significance of the difference in mean change within study groups. iAMD = intermediate AMD; SDD = subretinal drusenoid deposits; BCVA = Best Corrected Visual Acuity; ETDRS = Early Treatment Diabetic Retinopathy Study; LLVA =l ow luminance visual acuity; LLD = low luminance deficit; RIT = rod intercept time; ERG = electroretinogram. Figure 1. Scatter plots showing change in scotopic thresholds and rod-intercept time (RIT) from baseline to 12 months for 670 nm trial participants. Error bars represent the mean with standard deviation. Only assessments with less than 33% fixation error are displayed in RIT plots. (iAMD = intermediate AMD; SDD = subretinal drusenoid deposits. No significant difference was observed in mean ONL volumes between groups at baseline and 12 months (p = 0.679, p = 0.091 respectively). A substantial variation was found at baseline (p = 0.019)PDF Image | Effects of 670 nm Photobiomodulation in Macular Degeneration
PDF Search Title:
Effects of 670 nm Photobiomodulation in Macular DegenerationOriginal File Name Searched:
A_Pilot_Study_Evaluating_the_Effects_of_670_nm.pdfDIY PDF Search: Google It | Yahoo | Bing
Cruise Ship Reviews | Luxury Resort | Jet | Yacht | and Travel Tech More Info
Cruising Review Topics and Articles More Info
Software based on Filemaker for the travel industry More Info
The Burgenstock Resort: Reviews on CruisingReview website... More Info
Resort Reviews: World Class resorts... More Info
The Riffelalp Resort: Reviews on CruisingReview website... More Info
| CONTACT TEL: 608-238-6001 Email: greg@cruisingreview.com | RSS | AMP |