PDF Publication Title:
Text from PDF Page: 008
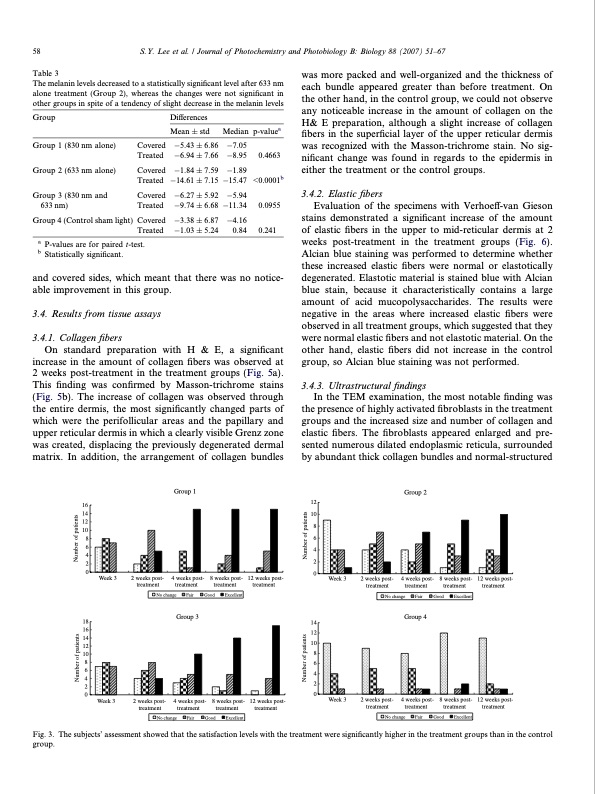
58 S.Y. Lee et al. / Journal of Photochemistry and Photobiology B: Biology 88 (2007) 51–67 Table 3 The melanin levels decreased to a statistically significant level after 633 nm alone treatment (Group 2), whereas the changes were not significant in other groups in spite of a tendency of slight decrease in the melanin levels was more packed and well-organized and the thickness of each bundle appeared greater than before treatment. On the other hand, in the control group, we could not observe any noticeable increase in the amount of collagen on the H& E preparation, although a slight increase of collagen fibers in the superficial layer of the upper reticular dermis was recognized with the Masson-trichrome stain. No sig- nificant change was found in regards to the epidermis in either the treatment or the control groups. 3.4.2. Elastic fibers Evaluation of the specimens with Verhoeff-van Gieson stains demonstrated a significant increase of the amount of elastic fibers in the upper to mid-reticular dermis at 2 weeks post-treatment in the treatment groups (Fig. 6). Alcian blue staining was performed to determine whether these increased elastic fibers were normal or elastotically degenerated. Elastotic material is stained blue with Alcian blue stain, because it characteristically contains a large amount of acid mucopolysaccharides. The results were negative in the areas where increased elastic fibers were observed in all treatment groups, which suggested that they were normal elastic fibers and not elastotic material. On the other hand, elastic fibers did not increase in the control group, so Alcian blue staining was not performed. 3.4.3. Ultrastructural findings In the TEM examination, the most notable finding was the presence of highly activated fibroblasts in the treatment groups and the increased size and number of collagen and elastic fibers. The fibroblasts appeared enlarged and pre- sented numerous dilated endoplasmic reticula, surrounded by abundant thick collagen bundles and normal-structured Group Group 1 (830 nm alone) Group 2 (633 nm alone) Group 3 (830 nm and 633 nm) Group 4 (Control sham light) Covered Treated Covered Treated Covered Treated Covered Treated Differences Mean ± std 5.43 ± 6.86 6.94 ± 7.66 1.84 ± 7.59 14.61 ± 7.15 6.27 ± 5.92 9.74 ± 6.68 3.38 ± 6.87 1.03 ± 5.24 Median p-valuea 7.05 a P-values are for paired t-test. b Statistically significant. and covered sides, which meant that there was no notice- able improvement in this group. 3.4. Results from tissue assays 3.4.1. Collagen fibers On standard preparation with H & E, a significant increase in the amount of collagen fibers was observed at 2 weeks post-treatment in the treatment groups (Fig. 5a). This finding was confirmed by Masson-trichrome stains (Fig. 5b). The increase of collagen was observed through the entire dermis, the most significantly changed parts of which were the perifollicular areas and the papillary and upper reticular dermis in which a clearly visible Grenz zone was created, displacing the previously degenerated dermal matrix. In addition, the arrangement of collagen bundles 8.95 1.89 15.47 5.94 11.34 4.16 0.84 0.4663 <0.0001b 0.0955 0.241 Group 1 Group 2 4 weeks post- treatment 16 14 12 10 12 10 8 86 6 4 2 0 18 16 14 12 10 6 4 2 00 Week 3 2 weeks post- treatment 4 weeks post- treatment 8 weeks post- treatment 12 weeks post- treatment 4 2 0 14 12 10 Week 3 Week 3 2 weeks post- treatment 8 weeks post- treatment 12 weeks post- treatment 12 weeks post- treatment No change Fair Group 3 Good Excellent No change Fair Good Excellent 8 86 Group 4 4 weeks post- treatment 4 2 Week 3 2 weeks post- 4 weeks post- 8 weeks post- 12 weeks post- treatment 2 weeks post- treatment 8 weeks post- treatment treatment treatment No change Fair Good Excellent treatment No change Fair Good Excellent Fig. 3. The subjects’ assessment showed that the satisfaction levels with the treatment were significantly higher in the treatment groups than in the control group. Number of patients Number of patients Number of patients Number of patientsPDF Image | LED phototherapy for skin rejuvenation
PDF Search Title:
LED phototherapy for skin rejuvenationOriginal File Name Searched:
LED-phototherapy-for-skin-rejuvenation.pdfDIY PDF Search: Google It | Yahoo | Bing
Cruise Ship Reviews | Luxury Resort | Jet | Yacht | and Travel Tech More Info
Cruising Review Topics and Articles More Info
Software based on Filemaker for the travel industry More Info
The Burgenstock Resort: Reviews on CruisingReview website... More Info
Resort Reviews: World Class resorts... More Info
The Riffelalp Resort: Reviews on CruisingReview website... More Info
| CONTACT TEL: 608-238-6001 Email: greg@cruisingreview.com | RSS | AMP |