PDF Publication Title:
Text from PDF Page: 111
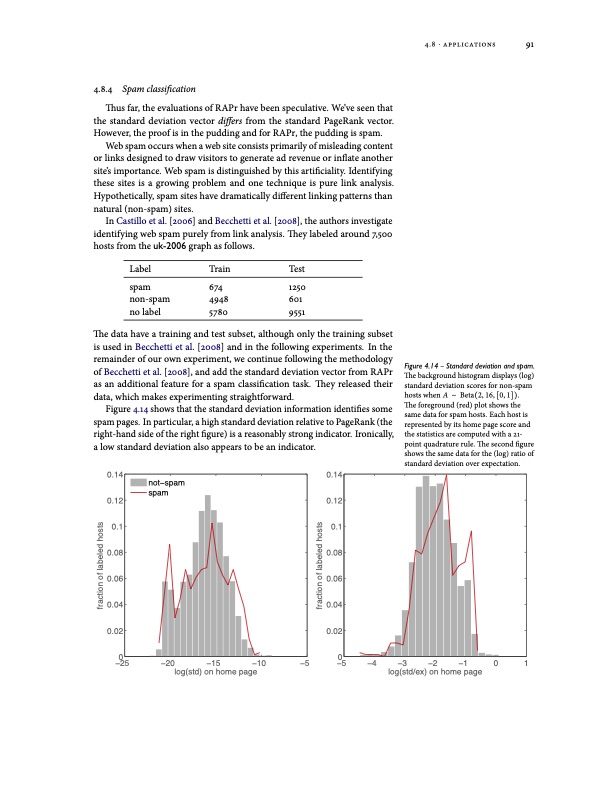
4.8.4 Spam classification Thus far, the evaluations of RAPr have been speculative. We’ve seen that the standard deviation vector differs from the standard PageRank vector. However, the proof is in the pudding and for RAPr, the pudding is spam. Web spam occurs when a web site consists primarily of misleading content or links designed to draw visitors to generate ad revenue or inflate another site’s importance. Web spam is distinguished by this artificiality. Identifying these sites is a growing problem and one technique is pure link analysis. Hypothetically, spam sites have dramatically different linking patterns than natural (non-spam) sites. In Castillo et al. [2006] and Becchetti et al. [2008], the authors investigate identifying web spam purely from link analysis. They labeled around 7,500 hosts from the uk-2006 graph as follows. 4.8 ⋅ applications 91 Label spam non-spam no label Train Test 674 1250 4948 601 5780 9551 The data have a training and test subset, although only the training subset is used in Becchetti et al. [2008] and in the following experiments. In the remainder of our own experiment, we continue following the methodology of Becchetti et al. [2008], and add the standard deviation vector from RAPr as an additional feature for a spam classification task. They released their data, which makes experimenting straightforward. Figure 4.14 shows that the standard deviation information identifies some spam pages. In particular, a high standard deviation relative to PageRank (the right-hand side of the right figure) is a reasonably strong indicator. Ironically, a low standard deviation also appears to be an indicator. Figure 4.14 – Standard deviation and spam. The background histogram displays (log) standard deviation scores for non-spam hosts when A ∼ Beta(2, 16, [0, 1]). The foreground (red) plot shows the same data for spam hosts. Each host is represented by its home page score and the statistics are computed with a 21- point quadrature rule. The second figure shows the same data for the (log) ratio of standard deviation over expectation. 0.14 0.12 0.1 0.08 0.06 0.04 0.02 0 −25 −20 −15 −10 −5 0.14 0.12 0.1 0.08 0.06 0.04 0.02 0 −5 −4 −3 −2 −1 log(std/ex) on home page 0 1 not−spam spam log(std) on home page fraction of labeled hosts fraction of labeled hostsPDF Image | MODELS AND ALGORITHMS FOR PAGERANK SENSITIVITY
PDF Search Title:
MODELS AND ALGORITHMS FOR PAGERANK SENSITIVITYOriginal File Name Searched:
gleich-pagerank-thesis.pdfDIY PDF Search: Google It | Yahoo | Bing
Cruise Ship Reviews | Luxury Resort | Jet | Yacht | and Travel Tech More Info
Cruising Review Topics and Articles More Info
Software based on Filemaker for the travel industry More Info
The Burgenstock Resort: Reviews on CruisingReview website... More Info
Resort Reviews: World Class resorts... More Info
The Riffelalp Resort: Reviews on CruisingReview website... More Info
| CONTACT TEL: 608-238-6001 Email: greg@cruisingreview.com | RSS | AMP |