PDF Publication Title:
Text from PDF Page: 155
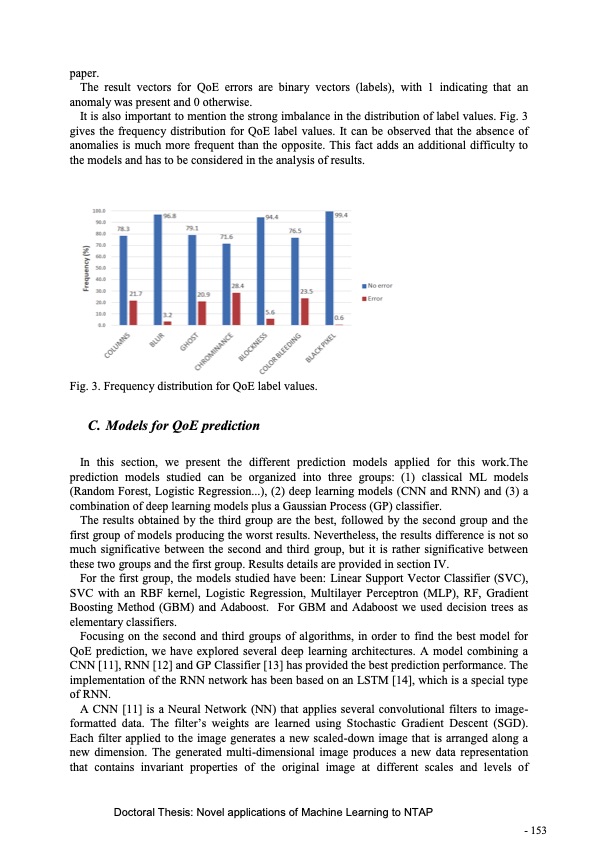
paper. The result vectors for QoE errors are binary vectors (labels), with 1 indicating that an anomaly was present and 0 otherwise. It is also important to mention the strong imbalance in the distribution of label values. Fig. 3 gives the frequency distribution for QoE label values. It can be observed that the absence of anomalies is much more frequent than the opposite. This fact adds an additional difficulty to the models and has to be considered in the analysis of results. Fig. 3. Frequency distribution for QoE label values. C. Models for QoE prediction In this section, we present the different prediction models applied for this work.The prediction models studied can be organized into three groups: (1) classical ML models (Random Forest, Logistic Regression...), (2) deep learning models (CNN and RNN) and (3) a combination of deep learning models plus a Gaussian Process (GP) classifier. The results obtained by the third group are the best, followed by the second group and the first group of models producing the worst results. Nevertheless, the results difference is not so much significative between the second and third group, but it is rather significative between these two groups and the first group. Results details are provided in section IV. For the first group, the models studied have been: Linear Support Vector Classifier (SVC), SVC with an RBF kernel, Logistic Regression, Multilayer Perceptron (MLP), RF, Gradient Boosting Method (GBM) and Adaboost. For GBM and Adaboost we used decision trees as elementary classifiers. Focusing on the second and third groups of algorithms, in order to find the best model for QoE prediction, we have explored several deep learning architectures. A model combining a CNN [11], RNN [12] and GP Classifier [13] has provided the best prediction performance. The implementation of the RNN network has been based on an LSTM [14], which is a special type of RNN. A CNN [11] is a Neural Network (NN) that applies several convolutional filters to image- formatted data. The filter’s weights are learned using Stochastic Gradient Descent (SGD). Each filter applied to the image generates a new scaled-down image that is arranged along a new dimension. The generated multi-dimensional image produces a new data representation that contains invariant properties of the original image at different scales and levels of Doctoral Thesis: Novel applications of Machine Learning to NTAP - 153PDF Image | Novel applications of Machine Learning to Network Traffic Analysis
PDF Search Title:
Novel applications of Machine Learning to Network Traffic AnalysisOriginal File Name Searched:
456453_1175348.pdfDIY PDF Search: Google It | Yahoo | Bing
Cruise Ship Reviews | Luxury Resort | Jet | Yacht | and Travel Tech More Info
Cruising Review Topics and Articles More Info
Software based on Filemaker for the travel industry More Info
The Burgenstock Resort: Reviews on CruisingReview website... More Info
Resort Reviews: World Class resorts... More Info
The Riffelalp Resort: Reviews on CruisingReview website... More Info
| CONTACT TEL: 608-238-6001 Email: greg@cruisingreview.com | RSS | AMP |