PDF Publication Title:
Text from PDF Page: 050
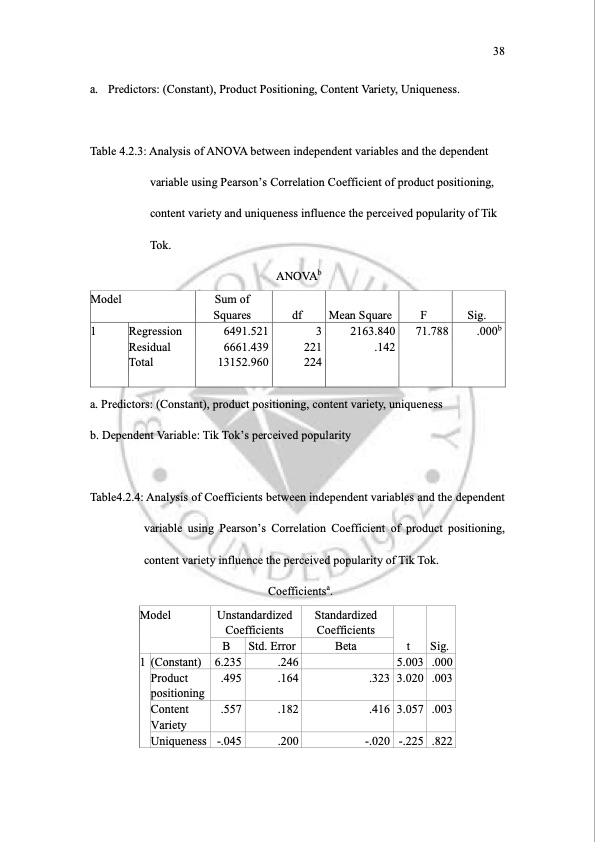
38 a. Predictors: (Constant), Product Positioning, Content Variety, Uniqueness. Table 4.2.3: Analysis of ANOVA between independent variables and the dependent variable using Pearson’s Correlation Coefficient of product positioning, content variety and uniqueness influence the perceived popularity of Tik Tok. ANOVAb a. Predictors: (Constant), product positioning, content variety, uniqueness b. Dependent Variable: Tik Tok’s perceived popularity Table4.2.4: Analysis of Coefficients between independent variables and the dependent variable using Pearson’s Correlation Coefficient of product positioning, content variety influence the perceived popularity of Tik Tok. Model Sum of Squares df Mean Square F Sig. 1 Regression Residual Total 6491.521 6661.439 13152.960 3 221 224 2163.840 .142 71.788 .000b Coefficientsa. Model Unstandardized Coefficients Standardized Coefficients B Std. Error Beta t Sig. 1 (Constant) 6.235 .246 5.003 Product positioning .495 .164 .323 3.020 Content Variety .557 .182 .416 3.057 Uniqueness -.045 .200 -.020 -.225 .000 .003 .003 .822PDF Image | STUDY ON THE PERCEIVED POPULARITY OF TIKTOK
PDF Search Title:
STUDY ON THE PERCEIVED POPULARITY OF TIKTOKOriginal File Name Searched:
thesis-tiktok-popularity-perceived.pdfDIY PDF Search: Google It | Yahoo | Bing
Cruise Ship Reviews | Luxury Resort | Jet | Yacht | and Travel Tech More Info
Cruising Review Topics and Articles More Info
Software based on Filemaker for the travel industry More Info
The Burgenstock Resort: Reviews on CruisingReview website... More Info
Resort Reviews: World Class resorts... More Info
The Riffelalp Resort: Reviews on CruisingReview website... More Info
| CONTACT TEL: 608-238-6001 Email: greg@cruisingreview.com | RSS | AMP |