Travel Reviews | Consulting | Analysis TEL: 1-608-238-6001
Email: greg@cruisingreview.com
New: Accounting iPhone Version for Bloggers and Travelers More Info
Star Princess Alaska Cruise The amazing cruise to Alaska seeing whales and panning for gold... More Info
June 2026 Riffelalp Resort High above Zermatt with views of the iconic Matterhorn... More Info
United Airlines - Free Domestic Starlink Service Unbelievable download and upload speeds... More Info
|
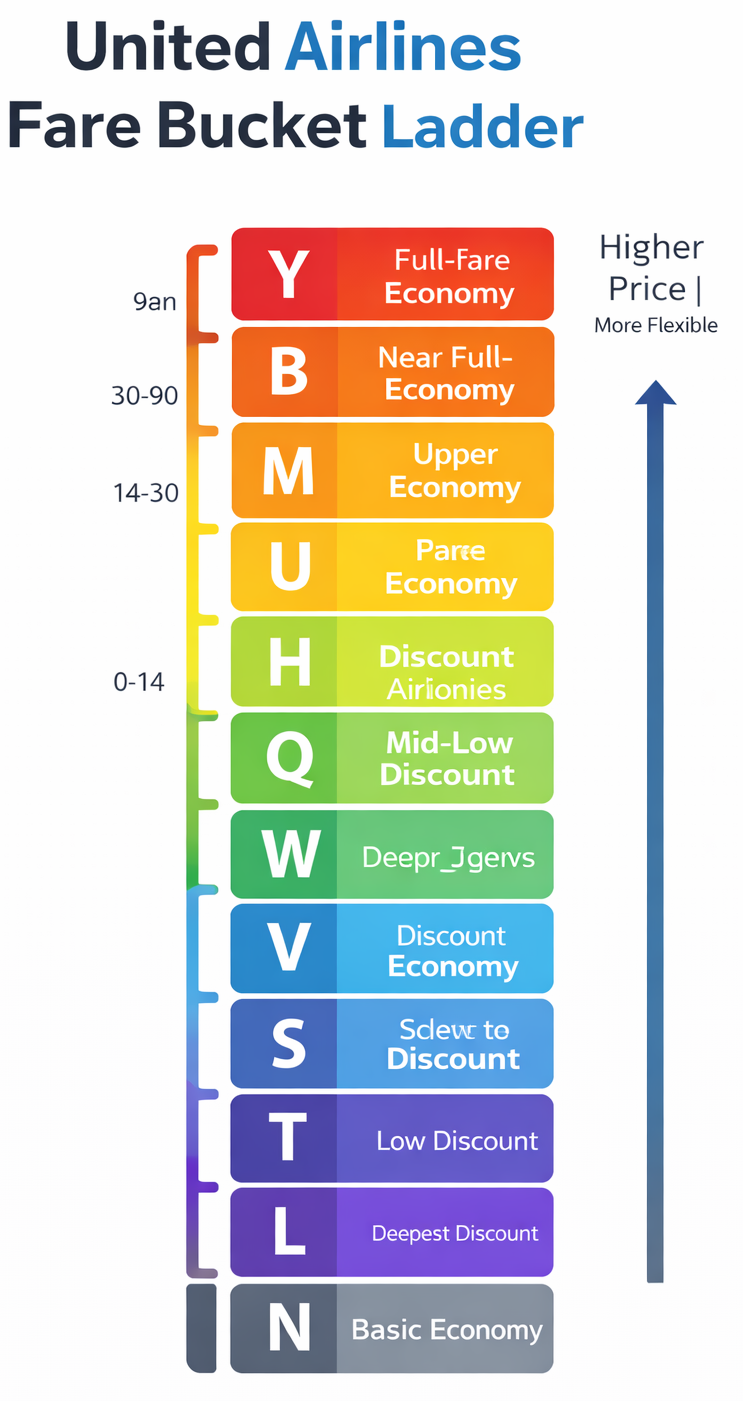
United Airlines Fare Buckets Fare Classes, Codes, and What They Really MeanAirline referenced: United Airlines1. What Fare Buckets Really AreUnited does not sell seats—it sells fare classes, also called fare buckets.Each bucket is identified by a single-letter code and represents:A specific price levelA defined set of rules (refundability, changes, upgrades)Priority in inventory controlMultiple passengers can sit next to each other on the same flight having paid very different prices because they booked from different fare buckets.2. United Airlines Fare Class Hierarchy (Top to Bottom)Below is the practical hierarchy, from most expensive / flexible to cheapest / most restrictive.First & Polaris Business Class BucketsJFull-fare Business / PolarisFully refundableMaximum flexibilityHighest priority for upgrades and changesRarely discountedCDiscounted BusinessRefundable or semi-flexibleCommon for corporate travelersDDeep-discount BusinessLimited availabilityUpgrade-eligible, but restrictedPremium Plus (Premium Economy)OFull-fare Premium PlusRefundableOften used for last-minute Premium Plus bookingsADiscounted Premium PlusLimited change flexibilityRUpgrade bucket (used for mileage or PlusPoints upgrades)Not generally sold outrightEconomy Class – High Fare BucketsThese are expensive economy fares, often booked close to departure.YFull-fare EconomyFully refundableNo advance purchase requirementUsed by corporate and emergency travelersBNear full-fare EconomyRefundable or lightly restrictedMUpper-mid EconomyChangeable with feesCommonly seen 1–2 weeks before departureEconomy Class – Mid Fare BucketsThese are the “normal” economy fares most leisure travelers see when booking early.EMid-tier EconomySome restrictionsOften used in fare salesUDiscount EconomyLimited flexibilityCommon sweet spot for valueHDiscount EconomyModerate restrictionsQDiscount EconomyAdvance purchase rules applyFares increase sharply when this bucket closesEconomy Class – Deep Discount BucketsThese buckets are the first to disappear as departure approaches.VDeep discountNon-refundableStrict change penaltiesWPromotional faresOften limited to specific datesSVery restrictedLimited inventoryTHeavily discountedOften tied to salesLLow-cost bucketRare close to departureKOne of the cheapest standard economy faresDisappears earlyBasic EconomyNBasic EconomyNo seat selectionNo changesLast boarding groupOften appears cheap but carries high risk and fees3. Why Flights Look Empty but Are Still ExpensiveFrom a fare bucket perspective:Cheap buckets (K, L, T, S, V) close earlyMid buckets (Q, H, U, M) close nextOnly Y, B, M remain close to departureSo even if:The aircraft is 50% emptySeats physically existOnly high-fare buckets may be open—making prices appear irrationally high.4. How United Uses Buckets StrategicallyUnited’s revenue system controls:How many seats are assigned to each bucketWhen buckets open or closeWhich customers see which pricesKey strategy points:Lower buckets close early to protect yieldHigher buckets remain open to capture urgent demandAI predicts whether discounting will reduce total revenueEmpty seats are acceptable if:Lowering price risks undercutting higher-paying travelersThe model predicts late business or corporate bookings5. Upgrade & Mileage ImplicationsFare bucket affects:Mileage accrual ratesUpgrade eligibilityPlusPoints priorityComplimentary upgrade rankingExample:Y/B/M fares upgrade ahead of Q/H/UN (Basic Economy) is last or excluded entirely6. Practical Advice from a Travel AgentTo avoid high buckets:Book when K–U buckets are still openAvoid booking inside 10 daysWatch when Q or H disappears—prices usually jump nextBe flexible with dates and airportsUse fare alerts and historical price tracking7. Summary Table| Class Type | Fare Codes | Price Level | Flexibility || -• | • | -• | -• || Business | J, C, D | Very High | Very High || Premium Plus | O, A, R | High | Medium || Economy (High) | Y, B, M | High | Medium–High || Economy (Mid) | E, U, H, Q | Medium | Medium || Economy (Low) | V, W, S, T, L, K | Low | Low || Basic Economy | N | Lowest | Very Low |Final TakeawayUnited’s fare buckets are the real pricing system, not the seat map you see online. Once lower buckets close, prices rise sharply—even if the plane is far from full. Understanding fare class codes gives travelers a powerful advantage in timing bookings and avoiding unnecessary premium pricing. |
|
United Fare Buckets Time Before Departure Buckets Typically Open What This Means for Price90–120 days K, L, T, S, V, W, Q, H, U, M Cheapest pricing window60–90 days L, T, S, V, W, Q, H, U, M Lowest buckets begin closing45–60 days V, W, Q, H, U, M First noticeable price increases30–45 days Q, H, U, M Mid-tier fares dominate21–30 days H, U, M Prices rise steadily14–21 days M, B Major price jump risk7–14 days B, Y Expensive economy only0–7 days Y only Maximum pricing, even if empty |
|
United Fare Bucket Types and Codes Class Type Fare Codes Price Level FlexibilityBusiness J, C, D Very High Very HighPremium Plus O, A, R High MediumEconomy (High) Y, B, M High Medium–HighEconomy (Mid) E, U, H, Q Medium MediumEconomy (Low) V, W, S, T, L, K Low LowBasic Economy N Lowest Very Low |
|
United Fare Buckets and how to Spot Price Jumps Typical Closure Timeline and How to Spot Price Jumps Before They Happen1. Typical United Fare Bucket Closure Chart> Important: These are typical patterns, not guarantees. AI-driven revenue management can accelerate or delay closures, but this chart holds true on most domestic and many international routes.Fare Bucket Closure Timeline (Relative to Departure)| Time Before Departure | Buckets Typically Open | What This Means for Price || --• | • | -• || 90–120 days | K, L, T, S, V, W, Q, H, U, M | Cheapest pricing window || 60–90 days | L, T, S, V, W, Q, H, U, M | Lowest buckets begin closing || 45–60 days | V, W, Q, H, U, M | First noticeable price increases || 30–45 days | Q, H, U, M | Mid-tier fares dominate || 21–30 days | H, U, M | Prices rise steadily || 14–21 days | M, B | Major price jump risk || 7–14 days | B, Y | Expensive economy only || 0–7 days | Y only | Maximum pricing, even if empty |Visual Rule of ThumbWhen Q closes → prices jumpWhen H closes → prices jump againWhen U closes → affordability window is goneWhen M closes → only expensive economy remainsWhen B closes → last-minute crisis pricing2. Why Bucket Closures Matter More Than Seat AvailabilityUnited does not reopen cheap buckets just because a flight is empty.Once a bucket closes:It usually stays closedThe system assumes remaining travelers are price-insensitiveAI models protect revenue integrityThis is why:A half-empty flight can cost $1,200The same seat cost $350 two weeks earlier3. How to Spot Bucket Changes Before the Price JumpsA. Watch the Pattern, Not the PriceIf you see:$327 → $329 → $331 over several daysThat’s price probing, not a real increase.If you see:$329 → $415 overnightThat means a bucket closed.B. Use Flexible Date CalendarsUnited’s calendar view is one of the best indicators.Warning signs:Entire week jumps by $80–$150Cheapest days disappearOnly one or two “low” days remainThis usually means Q or H just closed system-wide.C. Compare Adjacent DaysWhen:Tuesday is $380Wednesday is $395Thursday suddenly becomes $520That is inventory control, not demand.D. Look for Fare PlateausBuckets close in steps, not slopes.If you see prices stuck at:$350 for days → then jump to $460 and holdThat’s a bucket boundary.Plateaus = fare bucket floors.E. Monitor Change Speed| Change Pattern | Meaning || • | --• || Slow daily drift | AI testing demand || Overnight jump | Bucket closure || Jump + no reversal | Permanent tier change || Jump then partial drop | AI misread demand |4. The 3 Critical Bucket Alerts Travelers MissAlert 1: 21-Day LineOnce you cross 21 days, United often closes Q and H.If prices jump here:They rarely come back downAlert 2: 14-Day LineThis is the fare cliff.At this point:M becomes dominantCorporate fares take priorityLeisure discounts disappearAlert 3: 10-Day LineInside 10 days:AI assumes urgencyOnly B and Y remainEven empty flights stay expensive5. Travel Agent Booking StrategyBest Booking WindowsDomestic: 45–75 days outInternational: 60–120 days outPeak routes: earlierRed Flags to Book ImmediatelyQ disappearsCalendar prices flatten upwardCompetitors rise simultaneouslyFlight goes from “good deal” to “meh” overnight6. Simple Cheat Sheet| If You See This | Do This || --• | -• || Q still available | Wait or monitor || H only left | Book soon || M dominant | Book now || B/Y only | Delay travel or reroute || Prices jump overnight | Bucket closed — don’t wait |7. Final TakeawayUnited fare pricing isn’t random—it’s bucket-driven. Price jumps happen when fare classes close, not when seats sell out. Once you learn to recognize bucket behavior, you can book confidently before AI-driven pricing shifts the flight into premium territory. |
|
|
United Versus Delta Fare Buckets Factor United DeltaDiscount bucket longevity Short LongerFirst major price jump Early LaterAI aggressiveness High ModerateEmpty seat tolerance High LowerLast-minute shock pricing Very High ModerateBehavior United DeltaOvernight price jumps Common RareGradual daily increases Limited CommonBucket-driven cliffs Yes Less oftenCalendar volatility High ModerateTime Before Departure United Typical Behavior Delta Typical Behavior90–120 days Deep discounts wide open (K, L, T, S) Deep discounts open, often fewer seats60–90 days Lowest buckets begin closing Discounts remain but inventory tightens45–60 days Q begins disappearing Delta still selling lower fares30–45 days Q/H close rapidly Delta often holds mid discounts21–30 days M becomes dominant Delta still mixes H/M equivalents14–21 days Sharp price jump Gradual increases7–14 days B/Y dominate Some mid fares still appear0–7 days Full fare economy only High fares, but occasional softeningBelow is a publication-ready article written from a fare ticketing specialist and travel agent perspective, comparing United vs. Delta fare bucket timing—how quickly cheap fares disappear, when price jumps occur, and what that means for travelers.Page TitleUnited vs Delta Fare Bucket TimingHow Two Major Airlines Close Discounts and Drive Price JumpsMeta DescriptionCompare United Airlines and Delta Air Lines fare bucket timing, discount closures, and pricing behavior. Learn which airline raises prices sooner, how AI affects bucket control, and how travelers can book smarter.TeaserUnited and Delta both use fare buckets, but they don’t close them the same way—or at the same time. As a fare specialist, I see clear differences in how each airline manages discounts, last-minute pricing, and AI-driven demand forecasting. This guide explains how United and Delta bucket timing compares and how travelers can use that knowledge to avoid overpaying.ArticleIntroductionBoth United Airlines and Delta Air Lines rely on fare buckets—letter-coded pricing classes that control when discounts appear or disappear. While the concept is similar, the timing, aggressiveness, and flexibility of those buckets differ in important ways.Understanding these differences is critical because price jumps are driven by bucket closures, not by how full a plane looks.Fare Buckets: Same Tool, Different PhilosophyAt a high level:United prioritizes yield protection—closing cheap buckets early and keeping prices high close to departure, even on empty flights.Delta prioritizes price continuity—allowing some discount buckets to remain open longer while dynamically adjusting price within the same bucket.Both airlines use AI and demand forecasting, but they apply it differently.Typical Bucket Timing ComparisonEconomy Fare Bucket Closure Timing (Domestic Routes)| Time Before Departure | United Typical Behavior | Delta Typical Behavior || --• | • | --• || 90–120 days | Deep discounts wide open (K, L, T, S) | Deep discounts open, often fewer seats || 60–90 days | Lowest buckets begin closing | Discounts remain but inventory tightens || 45–60 days | Q begins disappearing | Delta still selling lower fares || 30–45 days | Q/H close rapidly | Delta often holds mid discounts || 21–30 days | M becomes dominant | Delta still mixes H/M equivalents || 14–21 days | Sharp price jump | Gradual increases || 7–14 days | B/Y dominate | Some mid fares still appear || 0–7 days | Full fare economy only | High fares, but occasional softening |Key Difference 1: When the First Price Jump HappensUnitedFirst major jump often occurs 45–30 days outTriggered when Q bucket closesPrices jump in large steps, not graduallyDeltaFirst jump typically closer to 21 daysDelta prefers micro-adjustments within a bucketFewer overnight shocks, more gradual increasesResult: United punishes late planners earlier than Delta.Key Difference 2: How AI Is UsedUnited’s AI StrategyPredicts willingness to payCloses buckets aggressivelyAccepts empty seats if yield targets are metAssumes urgency = higher price toleranceDelta’s AI StrategyFocuses on demand smoothingKeeps more pricing continuityAdjusts price within buckets instead of closing themSeeks higher load factorsTranslation: United uses AI to remove cheap options; Delta uses AI to reshape pricing curves.Key Difference 3: Empty Seats vs Price IntegrityUnitedWill fly half-empty at premium pricesProtects high fare bucketsRarely reopens discount inventoryDeltaMore likely to soften pricing lateSometimes releases limited mid-tier faresMore responsive to competitive pressureThis is why Delta flights often feel more reasonably priced closer to departure—even if still expensive.Key Difference 4: Price Shock vs Price Drift| Behavior | United | Delta || -• | • | • || Overnight price jumps | Common | Rare || Gradual daily increases | Limited | Common || Bucket-driven cliffs | Yes | Less often || Calendar volatility | High | Moderate |United travelers experience fare cliffs.Delta travelers experience fare slopes.Real-World Booking Example3 Weeks Before DepartureUnited:Q and H close → price jumps from $420 to $610 overnightDelta:Same route rises from $415 to $460 over several daysThe destination, demand, and aircraft are identical—the pricing strategy is not.Which Airline Is More Forgiving?From a travel agent’s perspective:United is better if you book earlyDelta is better if you book lateNeither airline is “cheap” last minute, but Delta typically avoids the extreme last-minute fare spikes common with United.How Travelers Should Adjust StrategyBooking UnitedBook 45–75 days outWatch closely for Q or H bucket disappearanceAvoid booking inside 14 daysBooking DeltaSlightly more flexibilityMonitor prices until 21 daysLook for fare plateaus instead of jumpsSummary Comparison| Factor | United | Delta || • | --• | -• || Discount bucket longevity | Short | Longer || First major price jump | Early | Later || AI aggressiveness | High | Moderate || Empty seat tolerance | High | Lower || Last-minute shock pricing | Very High | Moderate |ConclusionUnited and Delta both use fare buckets and AI-driven pricing, but the timing and severity of price increases differ significantly. United closes discount buckets earlier and faster, leading to abrupt fare cliffs. Delta allows more gradual pricing transitions, keeping some flexibility for travelers who book later.Knowing which airline you’re flying—and how its buckets behave—can easily save hundreds of dollars on the exact same trip. |
| CONTACT TEL: 608-238-6001 Email: greg@cruisingreview.com | AMP | PDF |